This article or section may need to be cleaned up or summarized because it has been split from/to Sea level#Change. |


Global or eustatic sea level has fluctuated significantly over Earth's history. The main factors affecting sea level are the amount and volume of available water and the shape and volume of the ocean basins. The primary influences on water volume are the temperature of the seawater, which affects density, and the amounts of water retained in other reservoirs like rivers, aquifers, lakes, glaciers, polar ice caps and sea ice. Over geological timescales, changes in the shape of the oceanic basins and in land/sea distribution affect sea level. In addition to eustatic changes, local changes in sea level are caused by tectonic uplift and subsidence.
Over geologic time sea level has fluctuated by more than 300 metres, possibly more than 400 metres. The main reasons for sea level fluctuations in the last 15 million years are the Antarctic ice sheet and Antarctic post-glacial rebound during warm periods.
The current sea level is about 130 metres higher than the historical minimum. Historically low levels were reached during the Last Glacial Maximum (LGM), about 20,000 years ago. The last time the sea level was higher than today was during the Eemian, about 130,000 years ago.[2]
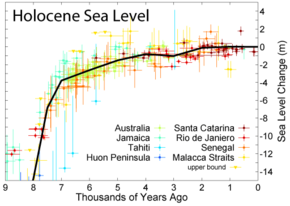
Over a shorter timescale, the low level reached during the LGM rebounded in the early Holocene, between about 14,000 and 6,500 years ago, leading to a 110 m sea level rise. Sea levels have been comparatively stable over the past 6,500 years, ending with a 0.50 m sea level rise over the past 1,500 years. For example, about 10,200 years ago the last land bridge between mainland Europe and Great Britain was submerged, leaving behind salt marsh. By 8000 years ago the marshes were drowned by the sea, leaving no trace of former dry land connection.[3] Observational and modeling studies of mass loss from glaciers and ice caps indicate a contribution to a sea-level rise of 2 to 4 cm over the 20th century.
- ^ Hallam et al. (1983) and "Exxon", composite from several reconstructions published by the Exxon corporation (Haq et al. 1987, Ross & Ross 1987, Ross & Ross 1988). Both curves are adjusted to the 2004 ICS geologic timescale. Hallam et al. and Exxon use very different techniques to measuring global sea level changes. Hallam's approach is qualitative and relies on regional scale observations from exposed geologic sections and estimates of the areas of flooded continental interiors. Exxon's approach relies on the interpretation of seismic profiles to determine the extent of coastal onlap in subsequently buried sedimentary basins.
- ^ Murray-Wallace, C. V., & Woodroffe, C. D. (n.d.). Pleistocene sea-level changes. Quaternary Sea-Level Changes, 256–319. doi:10.1017/cbo9781139024440.007.
- ^ "BBC - History : British History Timeline".
© MMXXIII Rich X Search. We shall prevail. All rights reserved. Rich X Search
